 |
| Figure 1. The nodes show the locations of detected earthquakes/tremors. The size of each node represents the magnitude while the colors represent the succession of events. |
From these nodes, we construct a directed network based on the following rules:
1. All events are initially connected based on their temporal sequence.
2. The distances of an event to all the other events preceding it are calculated. The closest past event is then connected to the to the current event being considered.
The constructed networks based on these rules are shown in Figure 2.
 |
| Figure 2. Network constructed for the events in Figure 1 based on the rules outlined above. |
In-degree and Out-degree Distribution
 |
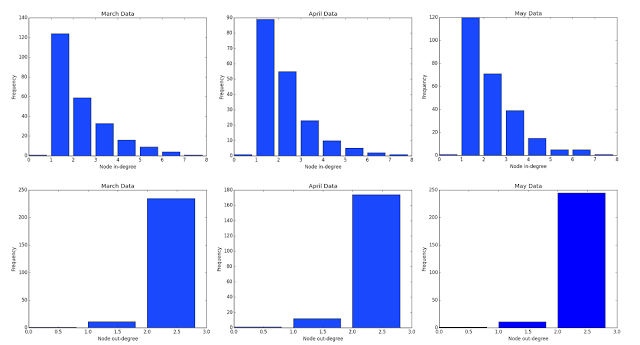
| Figure 3. In-degree and out-degree distribution for the constructed networks |
Figure 3 shows the in-degree and out-degree distribution for the networks. As expected, there are only three possible out-degrees: zero for the last node, one for a node when it is closest to its two otherwise. On the other hand, an in-degree of one is the most frequent among all three networks. This suggests that it is more probable for the next event to occur near the immediately succeeding event.
References:
1. Latest Earthquake Information. Retrieved from http://satreps.phivolcs.dost.gov.ph/index.php/earthquake/latest-earthquake-information
Collaborators:
Mary Angelie M. Alagao
Maria Eloisa M. Ventura


